Views

Monday, August 26, 2013

The winning exit strategy

So tracking six stocks was kind of fun, but at the end of the day, I couldn't really get an edge on trading them.  With the Fed Reserve pumping cash into the system, QE is inflating pretty much everything out there.  I could have thrown a bowl of spaghetti at the Wall Street Journal quotes page and would have made money on everything covered in sauce. 

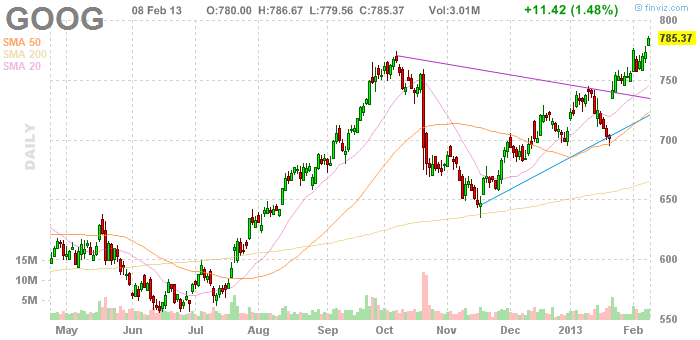
So I'm hoping that this is a good spot for family and friends to read and monitor some good trades.  Over the past few years, I've followed PnF trades, bullish wedges, bear flags, Head and Shoulders patterns, etc. - basically everything.  If you take a look at any chart, you can spot 3-4 patterns - depending on the time preference.  And everyone trades different. 

Personally, I'm not loaded.  I'm investing in my personal 401K and I don't have that much scratch in it.  I've never had a problem picking a winning trade.  I can spot and scan a winner with the best of them.  My problem has always been picking the right time to take profits.  I discovered the Green Line charts on Stock Charts, and it was really what I needed to help craft an exit strategy. 

In no way am I trying to hijack Joanne's method, but it's pretty damn good and her rules are simple. For me, they've really helped build confidence on an exit strategy of a winning trade.

Let's use Boyd Gaming as an example.  Boyd showed up last week as having a slow stochastic under 20, is above the 250 day EMA, and has a strong SCTR rating (>90).  Last Tuesday, the stock was trading at 11.84 when the slow stochastic turned up.
On the 60 minute chart, Boyd moved over the 10 day moving average, with a slow stochastic move above 20 and a MACD crossover.  September $12 call options were trading at 0.43 per contract on Tuesday.

The confirmation on the daily chart and 60 minute chart, made this a solid setup.  Sure enough, Boyd ripped up at the open today and eventually hit a high of $12.58.  Looking at the daily, the stock tried to push through $12.54 and just couldn't get anything going past $12.58 and failed miserably.  But after closing out on the 50 Minute EMA, options were trading at 0.77 per contract - an 80% return.


 When a stock can't bust through resistance, drop it.  Anyway, just wanted to share the anatomy of a winning exit.


Thursday, August 22, 2013

Revamped Model

Six Stock Trader is undergoing changes to its blog!  Basically, I've been a slackass who hasn't taken the time to post any new materials.  I plan on updating the site more in the coming weeks.

Friday, June 21, 2013

Update - absence

Well, the past few months have been extremely busy for me.  I've been working on a little model for myself and I actually cut down my tracking to only four items:

  • IWM (Russell 2000 ETF)
  • GLD (Gold ETF)
  • SPY (SP 500 ETF)
  • GOOG (Google)
Google tends to be a market leader, so I like to see how markets are trading Google.  Gold is usually my inflation hedge, but the current lack of inflation is troubling for Gold right now.  SP500 hit an all time high, but volume was thin on the movement up.  Scaling into SPY long Puts would have been prudent over the past few weeks.  I'm attempting to revise my trading techniques - minimizing risk and taking 20-30% gains whenever possible.  

Starting today, I plan on posting more aggressively.  I'm not a pro trader.  I'm just a dude trying to save money.

Saturday, February 9, 2013

2013 February 9 - CLOSE

It's been a while since I've been able to post to the blog here, but I wanted to go ahead and take a look at some of the charts for each of the six trades that we've been monitoring.  The stock market has been in an unbelievable bull trend over the past 3 to 4 months, so it's important now that we take a look at where each stock is positioned.  Now is the time to come up with a game plan for protecting ourselves against future losses.  If things are looking good for a stock, now could also be a good time to buy as more money from the sidelines could pile in the market over the next few weeks.

IWM is on a roll right now.  Until the trend changes, there's no reason to think this thing won't keep going up.


GLD holding steady at good support.


Google is an absolute terror right now.  There's no reason to think you it won't hit 800.


JP Morgan Chase had good support around 48 as you can see it bounced off of 48 and continuing higher up towards 50.


As you can see from the chart below Priceline tried to break out, but until it breaks the trend, there is no reason to buy - especially on low volume.


Exxon Mobil is having a little bit of trouble breaking passed a resistance point.


Wednesday, December 12, 2012

2012 December 11 - CLOSE

I've been slacking.  But looking at the numbers, I saw where IWM had incredible volume and a solid base that allowed it to pop up yesterday.


Check out the base I underlined in red below.  Finally, it popped.  This is a 30 MIN chart.

Google moved up on higher volume, but GOOG has had trouble moving over the $700 level in the past month.

Google is chopping along, but look at the selloff volume after the move up yesterday.  It will need good volume to propel it over $700.

PCLN bounced off the 50 DMA yesterday but saw huge selling .  JPM is still moving up in a nice channel.


And finally, waiting for GOLD to hit a support level and wouldn't be surprised if XOM bumps up to $93.


Friday, November 30, 2012

2012 November 29 - Close

I've been in some stocks other than our 6 (an admission of guilt), but I really like the movement in PCLN over the past few days.  I drew a basic line chart a few weeks back and it's still a good spot to view support and resistance in PCLN.  There was a good volume push on this, so I'm going to let the winners rip.

IWM and GLD both moved up on good volume, so I take that as a positive sign.  Be careful out there.


Wednesday, November 28, 2012

2012 November 27 - CLOSE

I've been out sick and haven't been able to fully follow the market, but IWM is the only high volume stymbol right now.  Everything else appears to be moving down on crappy volume, so proceed with caution.

Thursday, November 15, 2012

2012 November 15 - CLOSE

It has been a crazy week for me, but the market is on a serious downward trend.  IWM really taking a dive on high volume.


Saturday, November 10, 2012

2012 November 09 - Close

GOOG closed at resistance, so I'm excited to see how it looks on Monday.  With increasing talk of the fiscal cliff and other polcy, there has been a move out of stocks and into cash.  Gold (GLD) is moving nicely, as it acts as a hedge against inflation.

Here are some key things I'm looking at right now:


30 minute average volume on JPM is roughly 1.88 million right now.   Most everything has been trending down on good volume, so my goal is not to get stuck trying to hope for an upswing in the market. Everything is bearish, as it is under the 30 Day MA line.


The S&P 500 Bullish Percent index has dropped below 70, which means that it would be prudent to store cash away until the markets hit a soft spot.  The last time we were at this level, markets continued downward and the dollar had a nice move up.


Finally, on Google, check out the PnF chart to show support and resistance.  GOOG has been at this level before.  It appears to have stopped at support, but technically it is on a sell signal.  If Google doesn't open higher or if it doesn't get support at this level, the next move down is to the $640-645 level.


Thursday, November 8, 2012

2012 November 7 - CLOSE

I've been real busy with some stuff and haven't been able to blog.  The post election action is pretty good though with mazing volume on JPM yesterday.  Everything down, which is the same thing that happened on 2008 after Obama was elected.  I would call that a trend.  


As you can see, the Dow had downward trend from beginning of November to end of the month, so it will be interesting to see if history repeats itself.

Friday, November 2, 2012

2012 November 1 - CLOSE

I've been a little slammed these last few days, and Hurricane Sandy limited market activity earlier in the week.  Either way, I've attached Volume and Price over the past few days, so we can analyze the change in volume and price.  I've attached the info from 11/1/2012 (yesterday) and from 10/31/2012 (Wednesday).

As you can see, equities moved up on the first day of trading after hurricane Sandy.  But look below at the volume on 10/31...it's pretty weak.  GOOG has been rising on weak volume, which isn't a huge deal since it plummeted October 18.  IWM continues to trade in the $80.50- $82.50 range, and it appears to be trading at resistance this morning after the jobs report showed modest gains.


XOM continues to bounce off of the $90 level.  It was moving up in a nice channel, but it is recovering nicely.  There is some resistance at the 20 and 50 day moving averages, so today is going to be an interesting Friday on XOM.


Gold (GLD) is the one I'm watching.  As it continues to drop each day, I'm considering accumulating some positions on the way down.  Gold is bearish right now, so I'm looking for it to swing up after moving down for the next 20-30 days.


Wednesday, October 24, 2012

2012 October 24 - CLOSE


More downward pressure on price with light volume.  There is still a lot of sell off in the market, but the S&P continues to fall from the 1470 level, and next support is at 1400.


2012 October 23 - CLOSE

Nice range on Priceline (PCLN) yesterday and good Volume.  Gold continues to drop after hitting resistance (GLD).  IWM still remains bearish as it is under the 20 DMA, but there is support at the 200 DMA.

JPM is hanging out between support and resistance right now.  XOM took a big tumble, and next support level is around $86.65.


Finally, pay attention to the S&P Bullish Percent.  The number of stocks in the S&P 500 on Buy signal is decreasing.  If it drops under 70, there could be a massive selloff in the market.


Tuesday, October 23, 2012

2012 October 22 - Close


GOOG and JPM continue to trend down on higher volume than normal.  As for PCLN, I love the $560 area as a support line, and I could see it trend up to $600 over the next 20 days.  Also, the last 30 min of trading on XOM were pretty special yesterday.


Monday, October 22, 2012

19 October 2012 - Close

My apologies.  I was extremely busy at work over the past few days and was unable to update the worksheet.  GOOG took quite a tumble.  Admittedly, I had a short position in Google and got out of it on Wednesday because I didn't like the setup on the chart.  It kept moving higher early in the week - and on good volume.  I wasn't confident that it would cover on the short side, so I got out of it.  I even wrote last week that I liked GOOG to move up on good volume.  It was having trouble pushing though $745, but once it moved past it I figured it was too strong of a move to stay in the short position.  Thursday was a brutal drop where I missed out on a rare move down.


I really like how PCLN has hit support and bounced off this morning.  It should move to another resistance level of $585, so keep an eye on volume pushing it higher.  The support line was at $560, if you check out the point & figure chart.

Everything else is movign down with the market at large.  High volume and a downward trend are really battering the market right now.  Be defensive about each position, as a massive sell off could lead to capitulation.


Monday, October 15, 2012

2012 October 15 - Close

Well, Gold finally fell a little.  PCLN found good support, and JPM had some decent movement.  GOOG continues to fall, so let's try to see if it finds support tomorrow.  I could see GOOG making another run up to $775 - but only if volume supports it.


Friday, October 12, 2012

2012 October 12 - CLOSE


Market down as a whole.  Impressive Volume by JPM.  PCLN continues to tumble and with good downside support.